Creating DEM from PASDA las files

The following is a description of how the maps discussed in the previous post were constructed. This information is provided in the spirit of open access and replicability. The following is a step-by-step guide to building digital elevation models (and their derivatives) from PASDA LiDAR data.

  • Download las tiles from PASDA.
    • Go to PASDA Imagery Navigator: http://maps.psiee.psu.edu/ImageryNavigator/
    • Zoom in on the area of interest.
    • Under the Display Tile Index drop down menu, select “Lidar Hillshade”
      • This will show you the tile index and the relevant file names
    • Place your cursor over a spot of interest and right click.
      • This will bring up a list of available data.
      • Click on the “LiDAR,, Topo and DEM” tab
      • At the right, you will see a listing of “LAS” files for download.
    • Select and download all the appropriate files.
  • Convert projection and reserve only category “2” points (2= ground return).
      • Note that Pennsylvania Data MUST be converted from NAD83 PA S (feet) to NAD83 PA S (meters)
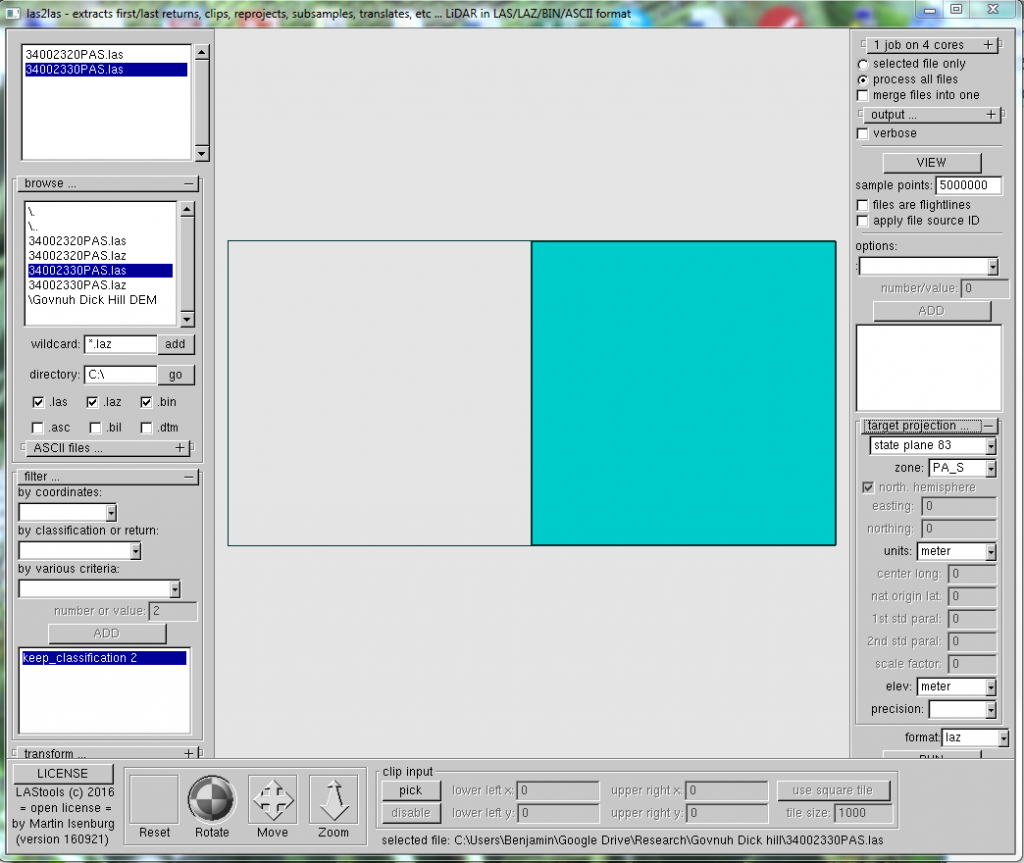
      • Open las2las.exe
        • In the upper left, find and select all of the files from the above.
          • Note that you can use the wildcard (.las, not .laz as is the default)
        • Keep only ground points
          • Expand the “filter” menu
          • Select “keep_classification” under “by classification or return”
          • Under “number or value”, enter 2
        • Reproject from feet to meters.
          • Under “target projection” select
            • State plane 83
            • PA_S
            • Be sure “units” are in meters.

Your GUI should look something like this:

forWP

  • Choose an output location in the upper right.
    • Click “Run” (in the lower left; you may have to minimize (click the “-“))
    • In the command line, you should see something like:
    • las2las -lof file_list.7808.txt -target_sp83 PA_S –olaz
  • You should now have reprojected las files that include only the ground return.
  • Convert las files into smaller “tiles”
    • Open “lastile.exe”
    • Add the reprojected las files (actually now they should be laz files) in the upper left.
    • Choose a tile size of 1000 (for the above this means 1000 meters)
      • Choose a buffer of 25 (you need a buffer and just need to experiment with what works best for you.)

Your GUI should look like this:

2lastile

    • Hit “Run”
    • The command line should look something like this:
      • lastile -lof file_list.1576.txt -o “tile.laz” -tile_size 1000 -buffer 25 -odir “C:\Users\Benjamin\Desktop\Working_LiDAR\Repoj_tile_las” –olaz
  • Convert tiles into DEM
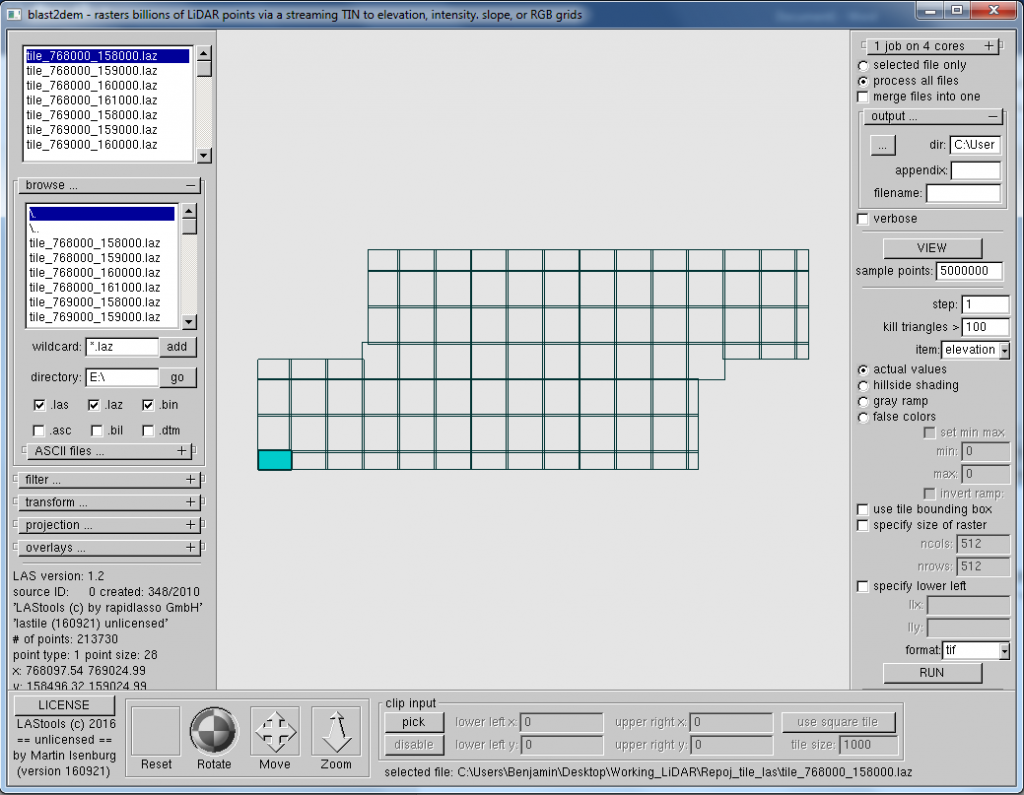
    • Open “BLAST2DEM.exe”
    • Add the tiles constructed in previous section
    • Choose your output location
    • Choose “tif” for file format

Your GUI should look like this:

3blast2dem

    • Click “RUN”
    • Your command line should look like this:
      • blast2dem -lof file_list.6620.txt -elevation -odir “C:\Users\Benjamin\Desktop\Working_LiDAR\DEM_tiles” –otif
    • Your DEM’s are now created.

From here, you will want to stitch the DEM’s back together, but you need a GIS program for that. You can use the open source QGIS.

  • Open QGIS
  • Click on Raster- Miscellaneous- Merge.
  • Select the “choose input directory instead of files” box
  • Select the destination location and file name.
  • Click “OK”-
    • I frequently get an error here, but the results appear complete.

At this point, all of your data should be in a single Geotiff file (be sure to save it) as a digital elevation model.

In order to complete the analysis in the previous post, I converted the DEM into a slope model, which shows high slope in lighter gray and low slope in darker gray.

  • To do this, all you need to do is, in QGIS, use Raster- Terrain analysis- Slope. The input is your DEM and the output is the new slope model.
  • Within QGIS, you should now be able to see maps similar to those shown in the previous post.

Finding Charcoal- LasTools + PASDA LiDAR data= Amazing!

For a long time, I have been interested in charcoal production on the mountains around the Lehigh Valley, which I first learned about along the Lehigh Gap Nature Center‘s  Charcoal Trail. I had hiked this trail many times before I discovered what the name meant. Along the trail are flat areas (around 30 feet [10 meters] in diameter) upon which colliers (charcoal makers) piled large mounds of wood that they charred to produce charcoal. One of the primary uses of that charcoal was iron production. Indeed, the area around the Lehigh Gap Nature Center (ok, a bit farther west) was owned by the Balliet family who owned and operated two iron furnaces, one on each side of the Blue (Kittatiny) Mountain (one in Lehigh Furnace, Washington Township and another in East Penn Township; and likely a forge in East Penn).

I became interested, but was not truly fascinated until I found and perused PASDA’s Imagery Navigator. Within the Navigator, you can view DEMs (digital elevation models) created from a LiDAR survey from around 10 years ago. To put it too simply, to collect LiDAR a plane flies over an area shooting the ground with lasers. Since the location of the plane is known (through an amazing combination of GPS and IMU) and the speed of light is known, lasers bouncing back to the plane effectively measure the distance to a “return”, which is an object, such as the tree canopy, a trunk, a roof, or the ground. A DEM is then constructed from the LiDAR point cloud. I wondered if this data could show me flat areas on the sloped landscape (like those clearly visible along the LGNC’s Charcoal Trail). They could!

I used the “hillshade,” which is a view of the landscape created by applying a light source to the DEM (digital elevation model). It’s as if all of the vegetation was removed from the landscape and it was painted gray with a sun shining on it from the NW at about 45 degrees. This way, I was able to identify over 400 charcoal pits over an area of approximately 100 square kilometers. .

So… many years later, I am finally doing something with this. My students and I, as a part of a Field Archaeology class, are investigating charcoal pits and the people who used them. More on this  part of the project another time.

In the meantime, my GIS skills have dramatically increased and I was lucky enough to attend a workshop on LiDAR (funded by NSF and run by NEON and Open Topography; a special thanks to Kathy Harring, Muhlenberg’s Interim Provost). I was interested in LiDAR for a new project that I am working on, but as a part of the workshop, we were to do a small “project” based upon new understandings and skills developed over the three days. I choose to download some of the original LiDAR data (props to Pennsylvania for providing all of this online) and build my own digital elevation model. The idea was that I could tweak it in order to see the landscape better. So, I started off just trying to remake the DEM provided via PASDA; that would at least show that I had developed some skills. However, just trying to do this resulted in spectacular results that have changed the way I conceptualize the landscape and our project.

Most importantly, the resolution of my reconstructed DEM is much, much greater than that of the DEM provided by PASDA. It is clear why this is true (see this description), but it is not apparent as it should be when viewing (or downloading) the PASDA DEM. PASDA provides a DEM based upon points that are categorized as “8,” which are “Model Key (thinned-out ground points used to generate digital elevation models and contours)”, not those categorized as “2,” which are “ground” points. So, I was working with all of the ground points and the PASDA provided DEMs were based solely upon a subsample.

Here’s what I found:

Here’s an image of one section of the area under study. This is original data from PASDA. Note the “eye-shaped” flat spots.

lidarchardemorig

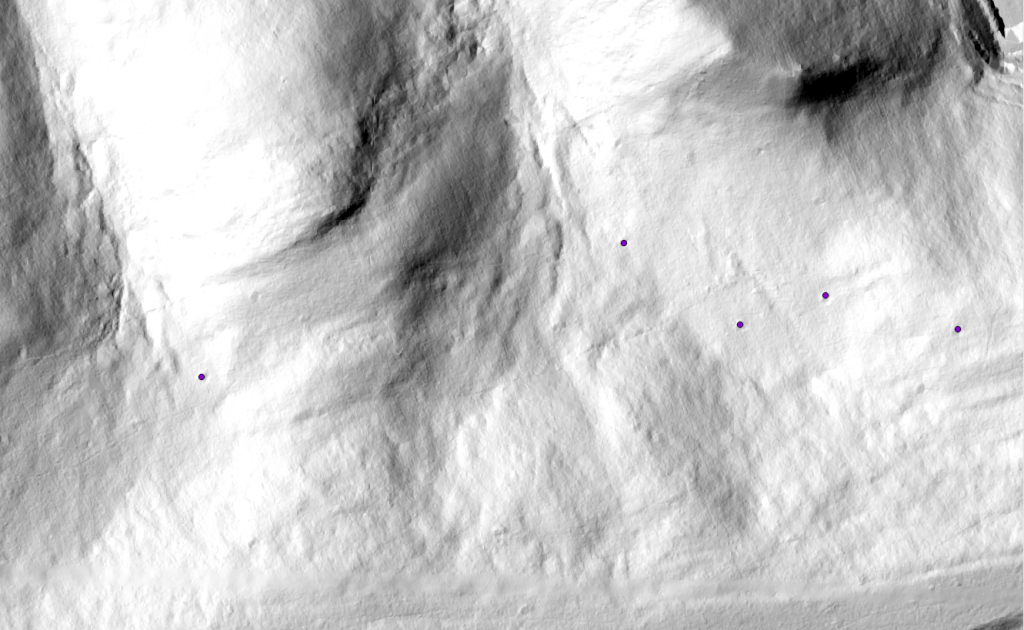
In the following image, I have marked all of the charcoal pits I could find with a blue dot.

lidarchardemorigpoints

This image shows the hillshade made from the DEM I built. Honestly, it doesn’t look terribly different from far above. Perhaps a bit more granular.

lidarchardemnew

However, here’s a zoomed in comparison of the area just NE of the point in the lower left corner in the image above:

Before:

lidarchardemorigsm

After:

lidarchardemnewsm

However, once I do a slope analysis, which shows flatter areas in darker gray and steeper areas in lighter gray, the charcoal pits (which are flat areas on a sloped landscape) literally leap out of the image.

lidarchardemnewslope

The image below shows all of the all of the newly identified charcoal pits with red triangles. A landscape that I once thought had minimal charcoal pits (I wondered why… and was developing possible hypotheses) now appears to have been quite densely packed with charcoal pits.

lidarchardemnewslopepts

Next post… details on exactly how I did the above. Hint- LasTools and QGIS.

Wanna collect data digitally?

(Note- originally posted here http://digitalarchaeology.msu.edu/wanna-collect-data-digitally/ on Sept 6, 2016)

This is my final post as a participant in the Institute for Digital Archaeology. This post serves three purposes. First, I announce a resource that I have created to enable digital data collection in archaeology. Second, I want to mention a few of my favorite aspects of the Institute. Finally, I just want to say a few thanks.

First, I announce a new resource for digital data collection in archaeology (see website ). While I initially planned to make something (I didn’t even really know what… an app?), instead I have cobbled together a couple of pre-built, “off-the-shelf” tools into a loose and compartmentalized system. And… because they are all well-supported open source tools they are also 100% free! On the website, I provide a justification for why I chose these tools, criteria for selection and descriptions of the tools. More importantly and even though all of these have low adoption thresholds (that was one of the criteria!), in order to support the testing, adoption and use of these tools in archaeology, I provide documentation on the ins and outs of using these tools. This means that you can be up and running in a matter of minutes (OK, maybe more depending upon download speeds…). In her final post Anne talks about toe-dipping and cannon-balling. My goal here was to suggest tools and provide assistance so that you either can dip your toes or jump right in; either way, I think you will see a big splash. I hope this helps. PLEASE LEAVE FEEDBACK. Please.

Second, I wanted to share two of my favorite aspects of the Institute. One, my colleagues. I have been honored to be part of such an open, collaborative and supportive cohort of insightful and dedicated scholars. I learned much simply from conversations over coffee at breakfast, Thai food at lunch and beers over dinner as I could hope to learn at any organized workshop or talk. Your struggles are as valuable to me as your final products. I want you all to know that I look forward to more conversations over beer, lunch (maybe Mexican this time?), and beer (did I write beer twice?). Two, time. I greatly appreciate the space that participating in this yearlong institution has given me. Without this institute, I think I would be still struggling away trying to put some sort of digital data collection system together in my “spare” time. No, it’s not done (is there such a thing), but the institute and the (dreaded) posts have kept me on track even though dead ends and unexpected turns.

Third, I want to thank the entire faculty. Of course, an especially large “THANK YOU” goes to Ethan and Lynne for putting the Institute together. I have learned so much from the rest of the faculty that I would like to thank them as well for their time and effort, both at the institute weeks at MSU as well as during the year in between. I understand the amorphous, complex, ugly (i.e. coding) world of digital archaeology much better than I ever thought I would. Thank you, Terry, Kathleen, Catherine, Brian, Shawn, Eric, Dan and Christine.

Lastly, a satisfied smile goes out to the NEH for supporting the Institute. Good decision! Amazing results! Just look.

Kobo Toolbox in the field- limitations? and solutions.

(Note: originally posted here: http://digitalarchaeology.msu.edu/kobo-toolbox-in-the-field-limitations-and-solutions/ on Aug 6, 2016)

This is a field report of efforts to develop a plan for low cost, digital data collection. Here’s what I have tried, what worked well, what did not and how those limitations were addressed.

First a description of the conditions. We live in two locations in Ecuador. The first is the field center established and currently run by Maria Masucci, Drew University. It has many of the conveniences needed for digital data collection, such as reliable electricity, surge protectors, etc. It does not have internet nor a strong cellular data signal. We are largely here only on weekends. During the week, we reside in rather cramped conditions in rented space in a much more remote location, where amenities (digital and otherwise) are minimal. There is limited cellular data signal (if you stand on the water tower, which is in the center of town and the highest point even though it is only one story tall, you can get a weak cellular data signal; enough for texts and receiving emails, but not enough for internet use or sending emails) and there is no other access to internet. We also take minimal electronic equipment into the field for the week (e.g. my laptop does not travel). So, everything needs to be set up prior to arrival in the field. The idea, therefore, is to largely use minimal electronic equipment in the field; I tried to use only one device (while also experimenting with others) for this reason. My device of choice (or honestly by default) is my iPhone 5s.

The central component of this attempt at digital data collection is Kobo Toolbox (see my earlier posts for more details… here, here, here and here), an open-source and web-browser based form creation, deployment and collection tool. Kobo Toolbox’s primary benefit is that, because it is browser-based, it is platform independent. You can use an iPad or an iPhone just as well as an Android device or a Mac or PC computer. This means that data can be collected on devices that are already owned or that can be bought cheaply (e.g., a lower level Android device v. an iPad). The form is created through their online tools and can create fairly elaborate forms with skip logic and validation criteria. Once the form is deployed and you have an internet connection, the user loads the form into a browser on your device. You need to save the link so that it can be used without a data connection. On my iPhone 5s, I simply saved the link to the home screen. A couple of quick caveats are important here. I was able to load the form onto an iPhone 4s (but only using Chrome, not Safari), but was unable to save it, so lost it once the phone was offline. I was unable to load the form at all on an iPhone 4 (even in Chrome). Therefore, although ideally the form should work in any browser, the reality is that it makes use of a number of HTML5 features that are not necessarily present in older browsers. Of course, as time goes on, phones and browsers will incorporate more HTML5 components and therefore, this will be less of an issue.

Once the form is deployed and saved on your device, you can collect data offline. When the device comes back online, it will synchronize the data you have collected with Kobo’s server (note that you can install Kobo Toolbox on a local server, but at your own risk). Then, you can download your data from their easy-to-use website.

For the first week, I set up a basic form that collected largely numerical, text and locational data. We were performing a basic survey and recording sites. Outside of our normal methods of recording sites and locations, I recorded sites with Kobo Toolbox in order to determine its efficacy under rather difficult “real-world” conditions. I collected data for 5 days and Kobo Toolbox worked like a dream. It easily stored the data offline and, once I had access to a data signal, all the queued data was quickly uploaded. I had to open the form for this to occur. I was unable to upload with a weak cellular data signal. It only completed uploaded once I had access to WiFi (late on Friday night). However, it synchronized nicely and I was able to then download the data (as a CSV file) and quickly pull it into QGIS.

The single biggest problem that I discovered in the field was that I needed to be able to see the locations of the sites recorded with Kobo Toolbox on a dynamic map. Although Kobo Toolbox recorded it nicely, you cannot see a point on the map, so I had to use another method to visualize what I was recording. The only way to see the recorded data is by downloading from the Kobo Toolbox, but a data connection is required. You can see and edit the data only if you submit as a draft. Once the data is submitted however, you cannot edit it in the field (this was true of other field collection systems that I have used, e.g. Filemaker Go). Yet, I still needed a way to visualize site locations (so I could determine distances, relationships to geographic features and other sites, etc. while in the field).

For this purpose I used iGIS, an free IOS app (see below for limitations; subscriptions allow additional options). Although this is an IOS app with no Android version, there are Android apps that function similarly. With this app, I was able to load my own data as shapefiles (created in QGIS) of topographic lines, previous sites and other vector data, as well as use a web-based background map (which seemed to work, even with very minimal data connection). Raster data is possible, but it needs to converted into tiles (the iGIS website suggests MapTiler, but this can also be done in QGIS). Although you can load data via multiple methods (e.g., wifi using Dropbox) I was able to quickly load the data using iTunes into the app. Once this data is in the app on the phone, an internet connection is no longer needed. As I collected data with Kobo Toolbox, I also collected a point with iGIS (with a label matching the label used in Kobo), so that I could see the relationship between sites and the environment. Importantly, I was also able to record polygons and lines, which you cannot do with Kobo Toolbox. Larger sites are better represented as polygons, rather than points (recognizing the c. 5-10m accuracy of the iPhone GPS). The collection of polygons is a bit trickier, but it works. Polygons and lines can later be exported as shape files and loaded into a GIS program. By using equivalent naming protocols between Kobo Toolbox and iGIS, one can ensure that the data from the two sources can be quickly and easily associated. The greatest benefit of iGIS is seeing the location of data points (and lines and polygons) in the field and being able to load custom maps (vector and raster) into the app and be able to view without a data connection. Although this is possible with paper maps (by printing custom maps, etc.), the ability to zoom in and out increases the value of this app greatly. Getting vector data in and out of iGIS is quite easy and straightforward. iGIS is limited in a couple of ways; nearly all of which are resolved with a subscription, which I avoided. Here’s a brief list of limitations:
– All points (even on different layers) appear exactly the same (same size, shape, color; fully editable with subscription). This can make it very difficult to distinguish a town from a site from a geographic location
– Like points, all lines and polygons appear the same (also remedied with a subscription). I was particularly difficult to tell the difference between loaded the many uploaded topolines and collected polygons.
– Limited editing capabilities (can edit location of points, but not nodes of lines; can edit selected data).
– Limited entry fields ( remedied with subscription, but, perhaps this is not necessary, if it can be connected to data collected with Kobo Toolbox).
– Unable to collect “tracks” as with a traditional GPS device (Edit- OK, so I was wrong about this! You can collect GPS tracks in iGIS, even though this is not as obvious as one might like).

The final limitation of iGIS was not something that was originally desired, but became incredibly useful in collecting survey data, especially negative results (positive results were recorded with the above). Our survey employed a “stratified opportunistic” strategy. We largely relied upon local knowledge and previous archaeological identification to locate sites, but also wanted to sample the highest peaks, mid-level areas and valley bottoms. In order to do this, we also used three different strategies. First, we utilized knowledgeable community members to take us to places they recognized as archaeological sites. Second, we followed selected paths (also chosen by local experts). Third, we chose a few points (especially in the higher peaks c. 200-300 meters above the valley floor). One of the most important aspects of this type of survey was recording our “tracks” so that we would know where we had traveled. This is commonly done with GPS units, but I was able to collect these using MotionX-GPS with the iPhone already in use. The GPS “tracks” (which are really just lines) as well as “waypoints” (i.e., points) were easily exported and loaded into QGIS. This allows for an easily collected data about where surveys traveled, but did not find archaeological sites. (Edit- Note that you can use iGIS for this function! MotionX GPS is not needed, therefore. It is great for recording mountain biking and hiking, however!).

One final comment will suffice here. I just discovered a new app that may be able to replace iGIS. QField is specifically designed to work with the open source GIS program QGIS. Although it is still new and definitely still in development, it promises to be an excellent open source solution for offline digital data collection- though limited to Android devices!

Crafting work flow- Kobo Toolbox/ PostGIS/ QGIS/ LibreOffice Base/ pgadminIII

(Note: Originally posted here: http://digitalarchaeology.msu.edu/crafting-work-flow-kobo-toolbox-postgis-qgis-libreoffice-base-pgadminiii/ on May 21, 2016)

Having largely decided on what tools to use (see previous posts: here, here and here), ironing out how this process will actually work has been a bit more difficult than hoped.

Two quick reminders. First, the goal of this project is to design (“stitch together” may a better term) tools for data collection and management (and eventually for archiving, etc.) that have relatively low adoption curves for most non-techie users. The primary audiences is for those on the “fringes” (though the fringes may be larger and perhaps more important than the “core”) of archaeology- those who have limited resources, such as graduate students, contingent faculty, faculty in small under-resourced schools, independent scholars, small contract firms, etc. Second, largely because of the first, all tools should be open access and the aim should be open access data (yes, perhaps with some- i.e., location- modified).

Kobo Toolbox and PostGIS form the essential core tools in this process. Kobo Toolbox is an easy to set up online/offline browser-based data collection tool. There really are no other OPEN ACCESS tools comparable to Kobo Toolbox (though there are numerous commercial tools). PostGIS is one (of many) spatial databases. I have chosen this largely because it is well-supported and widely used, but other database types would be useful as well.

Ok, down to the nitty-gritty. How to actually make this work!

First, we need to get data collected using Kobo Toolbox into the PostGIS database (because that is where the relational magic happens). This can be done through all three possible tools- QGIS, Libreoffice Base or pgadminIII. Determining which tool/method was the quickest, easiest and most accurate way took many, many hours of tinkering. I haven’t talked much about pgAdminIII, which is the GUI created to work with PostgreSQL databases and, therefore, will work best with PostgreSQL/ PostGIS data (though that doesn’t mean it is the best choice). QGIS and Libreoffice are designed to operate with a larger number of database types.

The key to understanding which tool is the most appropriate is remembering that your data is spatial. If you bring data into pgAdminIII or Libreoffice Base, they do not recognize what type of data is in each field (a.k.a. column). You have to specify the type for each column. In a large data table, this can be quite laborious, especially when using the PostGIS extension. However, QGIS is designed to work with spatial data. I found that importing recently-collected Kobo Toolbox data is best done through QGIS. Here’s how it’s done:

Once you have your PostGIS database up and running (I needed a friend to help do this, but once it is up and running, you are good to go), start a “New Project” in QGIS. Within QGIS, click on the “Add Delimited Text Layer” button (a). The following shows the resultant display completed:

b

Most importantly, note that, QGIS identifies the X and Y fields as the fields automatically labeled by Kobo Toolbox as “_Location_longitute” and “_Location_latitude.” If QGIS does not identify these columns as the geometry fields, you can do so with the drop down menu. Click “OK.” In the next box, you will need to identify a CRS (Coordinate Reference System). Kobo data is in WGS 84 (EPSG 4326), which is the most common CRS (if you need to you can transform your data to a new CRS later). Although it is not perfect, I encourage the use of WGS 84 because it can be deployed through the web more easily (e.g., via Google Maps, CartoBD, etc.).

Perhaps most importantly, QGIS also recognizes the format of many of the other columns. This is incredibly important because certain functions can be done with certain types of data (e.g. only numbers stored as numbers can be used in calculations; only data stored as text can be used in categorical labeling within a map; etc.). To see the format that QGIS identified for each column, right click the new layer and select Layers, then the Fields tab. You should see this:

c

Note many different “Types” of data- QString, int, double. If I bring this database into PostGIS via LibreOffice Base or pgAdminIII, I will need to specify the types. Of course, there are always problems with allowing software to automatically do nearly anything. In the above, “Students/student16” is identified as “QString,” but in reality this is a Boolean field (True or False). In this case, it was collected as a radio button in Kobo Toolbox and identifies whether or not this particular student was involved in the collection of each data point. This can be corrected later, but we do not want to do that yet.

The data is now in QGIS, but still lives in the CSV file. QGIS simply knows where to look to get data so that it can be mapped and the types of data so that they can be used appropriately (e.g., digits formatted as text cannot be used in a calculation).

We want this data in our PostGIS database so that it can be related to other data.

First, more the CSV data to PostGIS. This is relatively simple with DB Manager in QGIS. First, be sure to establish a connection with your database (see this link) Now that you have a connection, you can interact with your database. DB Manager is a tool to interact with spatial databases. DB Manager is a plugin that is now part of the core download. If it is not apparent, you can always install it as a plug-in. Click on Database–> DB Manager –> DB Manager at the top of the screen.

d

You will see:

e

Expand “PostGIS” by clicking on the +. You should see your database (if not you will need to establish a connection).

Your view should now look something like this:

f

With the layer from your imported CSV highlighted in the Layers Panel in QGIS, click on “Import Layer/ File” (g). Use settings similar to these:

h

Please note that you must identify the primary key as “_uuid” because this is a unique id assigned by Kobo Toolbox. Every table in a relational database must have a primary key that it uses to uniquely identify each record (row). You should not identify a column for geometry because there isn’t actually a column in the CSV file for this. QGIS will create it based upon the TWO columns you told it to use as X,Y coordinates and store it in a “geom” column.

Once you click OK, you should see a message that your data was successfully imported.

Although you have imported the data into your PostGIS database, it will not yet appear in your QGIS map. To do so, click on “Add PostGIS Layers” (i). In the subsequent screen, establish a connection (if not already established through the browser, you may need to click on “New”). Then select the newly imported file. Your screen should look similar to this:

j

Once you have selected the appropriate file, click on “Add”. This will add a new layer from your PostGIS database. It should look similar to this:

k

Note that, in the image above, the newly imported PostGIS data (in red)sits directly above the data in the CSV file (in green).

Finally, one should note that, the main difference between the CSV file and the table in the PostGIS database is that the data is defined by type.

However,  there are two additional components of a relational database that make this conversion important. First is the ability to establish relationships between tables (which you cannot do with CSV files). Second is the ability to update your data with new information.
Although there is no space (or time) for addressing both of these issues at this point, these are important to remember in the strategy.

In subsequent posts, I will address how to update your data with newly collected information and how to establish relationships. It should be noted that this can be done through the same three tools- LibreOffice Base, QGIS and pgAdminIII.
Why PostGIS?

(Note- Originally posted here: http://digitalarchaeology.msu.edu/why-postgis/ on April 8, 2016)

Benjamin Carter, Muhlenberg College

This will be a relatively quick post. As promised in this post, I will discuss PostGIS, a relational database management system.

First, what is a relational database and why should archaeologists use them (for a fuller explanation and discussion see Keller 2009 and Jones and Hurley 2011)? Of course, many archaeologists already use these (especially at larger contract archaeology firms), too many of us avoid them. Indeed, even in graduate school, I never discussed data organization (presumably this is common). However, the way that you organize your data can reduce time spent data wrangling and promote richer analysis. It also promotes and limits certain types of analysis.

Let’s contrast a relational database to the “flat” file (often in the form of an Excel spreadsheet) that is all too common in archaeology. Anyone who has used a spreadsheet knows that they are incredibly frustrating to use: Have you ever sorted by a column and then found that you didn’t highlight all of the columns. Now, one column is disconnected from its rightful data. No problem, right? That’s why there is an undo button. What if you accidentally saved it? No problem, you have that archived copy, right? Where was it?

Analyses of data in flat files are constrained by the contents of the spreadsheet. Even if you have multiple sheets in separate tabs (e.g., one for ceramics and one for lithics), they are not linked (yes, you can link through formulas, etc., but that is laborious as well). What if you need to input a new set of information? Let’s say you have a context code that includes site, unit and level, but you want to analyze by unit, you would need to create a new column and either manually enter the unit or digitally separate the unit from your context code. All of this takes time, creates poorly organized files that are difficult to reuse (frequently because data is disconnected from its metadata). Similarly, these frequently lack the appropriate metadata that allows them to be shared and archived. They are largely designed for and with the interests in mid of a single researcher (or perhaps a small team). Frequently, specialists have disparate spreadsheets that cannot “talk” to each other.

While no database is perfect, relational databases can alleviate many of these issues. The essential concepts behind a database are to disaggregate data, limit busy work and standardize your data (Note that this never means that you would lose the qualitative narrative). This reduces time and increases quality control. To conceptualize a relational database, think of multiple tables linked together. For example, I may have an excavation table with a wide array of data, including a column with site number. Each “record” (i.e., row) includes all the nitty-gritty information from a single layer from a single unit. If I use the trinomial system, there are three pieces of information buried in a single number/ column (state, county, site number). However, if I wanted to disaggregate these pieces of information in a spreadsheet, I would need to make new columns and do a great deal of copying and pasting all the while risking separating a piece of data from its original record. In a relational database, the original table can be easily connected to a small table that includes one column each for trinomial number, state, county and site number, but only ONE record for each unique trinomial. Then you create a “relationship” between the trinomial column in the original table and the trinomial column in the new table. In other words, each record (row in a table) of your original data is directly linked to state, county and site number with no insertion of columns or copying and pasting of data. Imagine your original table includes three sites in two counties and a total of 1000 records (levels of units). To associate state, county and site number with the trinomial, you would need to insert three columns and copy and paste data into the right cells for all 1000 records (that is, you have created 3000 additional pieces of data; I hope you didn’t waste field time writing your state on each form! With a relational database, you only need to create three records (12 pieces of data). However, because of the relationship created, you have actually created the same 3000 data points. Sounds a bit more efficient, no?

I recently worked with census data from North Atlantic Population Project . Much of the data is coded. The downloaded data includes numbers that mean nothing to me, but those codes can be linked to text; a 336 in the IND50US column (Industry categories in 1950) means “Blast furnaces, steel works, and rolling mills”. The original data table is linked to a small table (indeed many of them) that convert apparently meaningless codes into understandable text.  This means that I entered the words “Blast furnaces, steel works, and rolling mills” only once, but they are now associated with all 600 records in the original table from NAPP that included the “336” code in the IND50US column.

Why Post GIS? PostGIS is simply a spatial extension of PostgreSQL, an “object relational database management system.” That is, it is simply a language for creating and organizing relational databases. The main reason for choosing this system is that it is incredibly popular, widely used in industry and academia. It is open source and works on all computer platforms; it is now the native on Mac OSX servers. It can be stored a server or on your computer.  I prefer a graphical user interface and pgadmin, the “native” client for accessing and editing your database, is not intuitive to me. However, I am in the process of switching word processing and spreadsheets to the open source LibreOffice Suite. LibreOffice Base, their answer to MS Access/ Filmaker Pro has native support for PostgreSQL. Other database management programs, such as the two mentioned in the previous sentence, also have native support for PostgreSQL (i.e., you do not need to use LibreOffice).  Similarly, PostgreSQL/ PostGIS is supported by GRASS/QGIS,  an open source GIS programs (This is a huge plus. Most data in GIS programs are in the flat files ridiculed above). While PostgreSQL/ PostGIS is certainly not the only option available to do these things, it appeared to be the most widely supported.

Finally, I will openly admit that I have only begun to work with PostGIS/ LibreOffice Base and I am having some difficulties. I will refrain from being too critical yet because it may simply be part of the learning curve.

Kobo Toolbox ( a field data collection web app discussed here) yields tables that

To open a can of worms that I am still struggling with, I will suggest that relational databases will allow field data to be easily converted into (or perhaps collected as) linked open data.

Inexpensive, easy-to-use data collection: Kobo Toolbox as an example.

(Note- Originally posted here: http://digitalarchaeology.msu.edu/inexpensive-easy-to-use-data-collection-kobo-toolbox-as-an-example/ on Feb 29, 2016. )

As promised in my previous post , this post is about using Kobo Toolbox as a data collection tool for archaeology. I also address important issues that have materialized as I design and use forms in Kobo Toolbox.

What is Kobo Toolbox? Kobo Toolbox is an open source suite of tools for the collection and analysis of humanitarian data- especially in remote places or after a disaster. Kobo Toolbox is comprised of three different tools, one for form design, one for data collection and another for data analysis (the latter is rather simple and won’t be discussed here). Kobo Toolbox can be used from their website or installed on a local server. It was designed by a fairly large collective organized by the Harvard Humanitarian Initiative and supported by lots of heavy hitters, including the United Nations, the International Rescue Committee and US government- through USAID. It is very well supported and has a very active and dynamic user and collaborator community.It appears to be sustainable. Similarly, the data collection form is based upon Enketo, another open source, well supported and actively growing tool.

Why Kobo Toolbox? First and most importantly, Kobo Toolbox is device independent (though there is an Android app as well). Instead of operating via an app, it runs as a webform that can be accessed through a browser on any device that can run a browser (browser does need to be updated to handle HTML5; Google Chrome seems to be the best at this point; see this). With the expansion of the use of smartphones throughout the world, this is incredibly significant. Anyone with a device with a browser can collect data. Personally, in trying to devise ways to collect archaeological data digitally, I purchased software and hardware into the $1000s- and I was doing it “on the cheap”. As my two iPads aged substantially between field seasons, I became increasingly frustrated because the expectation was that I was going to need to purchase new iPads in the near future- I was stuck in the technology treadmill. The system was unsustainable. With Kobo Toolbox, an inexpensive smart phone (yes, they do exist) is all one needs. Data collection becomes much less restricted and the opportunities for collaboration with interested communities, especially in remote places, is much, much greater.

Second, web forms can be used OFF-LINE! That’s right, a WEB form that can be used OFF-LINE. This is essential for nearly all situations in archaeology. Even if you have access to the internet (through nearby WiFi or a cellular data connection), it is likely that your connection will be cut at some point- usually the most inconvenient one- leaving you unable to collect data. Not with Kobo Toolbox. You can continue to collect data; it will upload and synchronize once a data connection has been reestablished. How much data is based upon the browser and settings with the browser; here’s details for Google Chrome. Important update: questions are stored in question banks that can now be shared!

Third, Kobo Toolbox includes an intuitive form design tool via the web. Most importantly, this means that the “learning curve” or threshold is very low. I was able to create basic forms in minutes the very first time I tried the tool. However, for more advanced data collection, the web design tool can be nearly as complicated as one desires. Data types are varied and include everything from alphanumeric to GPS location to images and audio. There are some qualifiers here; for example, barcodes can be collected using the Android app, but not the web form. Data can be collected by radio buttons, check boxes, drop down lists and many other ways. Options include skip logic (i.e. show certain questions based upon the response to previous questions) and validation criteria, both of which increase ease of use and the reliability of the data. Form construction can be even more complex if XLSforms (http://xlsform.org/ )(based upon the open standard XForms; https://www.w3.org/MarkUp/Forms/ ) are used. XLSforms can be designed using the ubiquitous Microsoft Excel (LibreOffice Calc (https://www.libreoffice.org/discover/calc/ ) could be used as well and the file saved as .xls). The tool, therefore, is incredibly easy to use from the very beginning, but can be as complex as the user demands.

HE sample form
A portion of the data collection form in Kobo Toolbox

How about a quick example? In the fall of 2015, I taught a course entitled “Historical Ecology of the Lehigh Gap” at Muhlenberg College, which was “clustered” with another course, “Degradation and Restoration” taught by my colleague Kimberly Heiman. As a component of this course, we mapped plant distributions along a transect through the Lehigh Gap Nature Center. The Lehigh Gap is a Superfund site contaminated by heavy metals from a zinc factory. The purpose of the transect was to identify different plants that represented degraded or restored communities. I created the form (see example) in an evening and shared the link with the students.


In the field, students pulled up the link on their smartphones. Although there were some hiccups, the form worked like a charm. We had one phone that could not use the forms- we still do not know why. Some students found that one browser was preferable to others (Chrome seemed to be the best) and we had significant issues collecting photos. Except for a few exceptions, GPS coordinates were within their known error (c. 10 meters). Those points that were not located within the expected 10 meters appear to have been random. That is, there was no apparent pattern that would suggest particular phone brands, individual phones, or users that were less accurate than others. The data was exported (via CSV) and imported into CartoDB, which students used to analyze the spatial distribution of plants. The map below shows one day of collection and only shows one plant, sweet birch, which in this case actually shows the effectiveness of prescribed burns on the northeastern portion of the transect (birch tend to pull heavy metals from the soil and reintroduce them into the ecosystem; controlled burns limit the growth of birch).

HE sample map
A sample of data collected in Kobo Toolbox being displayed in CartoDB.

This was a particularly effective exercise. We were able to collect approximately 75 data points on 10 plants at 10 meters intervals (i.e. a distance of 3/4 kilometers) in approximately 2 hours with 17 students. Data collection required no special tools, but students were able to collect and analyze a rich data set with relatively simple, intuitive tools.

Ok, it may appear that I am trying to “sell” Kobo Toolbox. However, let’s face it, there are some drawbacks to Kobo Toolbox.
First, data entry via a small screen virtually requires that typing be minimized- drop down boxes, radio buttons, etc. are far superior. This means that it is preferable to design these types of data entry into the form, which has the positive effect of standardized data, but also can reduce recording important, narrative data. Really, this is not a drawback of Kobo Toolbox, but of the device. Narrative data would be best collected via audio or text through voice recognition, but neither of these is ideal either.

Second, because Kobo Toolbox is designed around location collected through the device GPS, it is wonderful for survey, but the location aspect is less useful for excavation. If a sub-centimeter RTK GPS was connected to the device (via Bluetooth?) the location aspect of the form would be much more useful for archaeology, but that requires serious expense (or, perhaps not). The device could also be connected via Bluetooth to a total station, etc. for increased locational control. Excavation data is likely better collected via a tablet, rather than a phone.

Third, initially I wanted a tool that could be connected directly to a relational database; at this point, this cannot be easily done with Kobo Toolbox. However, because the format of the Kobo export is a CSV file, the data can be easily synchronized with any database, relational or otherwise with relatively little effort. I am now convinced that this sort of compartmentalization is actually preferable. With such a format, the user can decide how to store, analyze and archive their data. While I now prefer a PostGIS database accessed through a LibreOffice Base, others may prefer to database types or GUIs. Compartmentalization means that no one tool is reliant upon any other, but it does mean that standardized (and preferably open) data formats are required to go between tools. Compartmentalization also means that forms must be designed with the database in mind and vice versa, the database must be designed with the intension that all data will be arriving in CSV files (alternatives include KML and XLS; except images, audio, etc., which must be entered into the database manually).

Fourth, I also initially wanted the ability to modify forms in the field. I was able to do this with my initial Filemaker Pro database, but only because I carried the server into the field. However, I used adjusted forms largely during field testing. Adjusting forms in Kobo Toolbox once they have been deployed is difficult, requires an internet connection and new “projects” must be created with new URLs, etc (side note- you can install Kobo Toolbox on your own server and take it into the field). However, once past the testing phase this may not be important; once data collection has begun in earnest, changing forms is usually a poor idea because it reduces consistency and makes synchronization more difficult.

Although Kobo Toolbox has some important limitations, I now consider these limitations to be beneficial. Open source tools that do one thing extremely well and that use open standards and open file formats are preferable because their output is useful in a wide variety of other tools (and in ways that I cannot even imagine).

Robust, Open, Flexible and Offline Digital Data Collection in the Field.

(Note- originally published here: http://digitalarchaeology.msu.edu/robust-open-flexible-and-offline-digital-data-collection-in-the-field/ on Sept. 25, 2015).

First, a little background… My name is Ben Carter and I am currently an assistant professor of anthropology at Muhlenberg College in Allentown, PA. However, I came to the project described below long before I was lucky enough to get my current job. My essential perspective was forged in the fires of many years in “in-between” states- as a graduate student, an adjunct and a non-tenure-track faculty member. At the same time, I was trying to run a field school- because I believe in the fundamental pedagogical value of field school for those going into archaeology and for everyone else. However, because I operated in these in-between states, I often had severe budget and time constraints. Initially, I had hoped to employ digital tools in the field in order to save time, thus allowing me to spend more time with my students discussing important anthropological issues and less time on data entry. Although I have field tested a range of options; none have done what I want them to do (and most cost me MORE time). Indeed, my students will tell you that these attempts, while perhaps educational, were quite frustrating.   Therefore, broadly speaking, my goal has been to develop a field data collection system that is inexpensive, easy to deploy and use and results in data in a format that can be openly shared. These characteristics would not only ensure my own ease of use, but enable other archaeologists to give it a whirl. The project should yield a product useful to graduate students, faculty with severely limited resources, community projects, small CRM firms and anyone else.

Beyond my own experience, archaeologists have been shifting towards collecting data digitally in the field for some time. These systems can be as simple as using an app on a smart phone or as complex as setting up a WiFi network- including a server (laptop) and multiple data collection devices (such as iPads)- in the field.  We have done this largely to reduce both time spent converting paper-based data to digital as well as to reduce the errors introduced in this process. Also, a digital collection system is simply the first stage of a digital pipeline that funnels data to both online publishing and archival platforms. However, many of the systems developed within archaeology have been hampered by five major concerns:

First, many employ proprietary software (Filemaker Pro is one of the best known) and/or hardware that limit the integration, analysis and open dissemination of data and restrict flexibility. Similarly, once entangled in proprietary software and hardware, it is extremely difficult to leave- at least partially because they have a steep learning curve.

Second, the cost of proprietary software and the devices needed to deploy it limit its applicability to  larger, well-funded academic projects or CRM companies. Smaller groups and individuals, including small academic teams, faculty at small less-well-funded schools, graduate students, and small CRM firms, cannot sustainably afford these systems, even if the may be able to afford a one-time purchase.

Third, while proprietary software often supplies a wide array of options making it attractive, they can neither provide all present requirements nor those that may be necessary in the future. An open, community-based tool can be relatively quickly re-purposed and modified to account for nearly any contingency- in the present or the future. All this should be possible with minimal time investment and assistance from an open source community.

Fourth, most of these data collection systems require either a wireless local network or a connection to a cellular network so that the collection tool, such as a tablet, can communicate with the database on a server. While this is logistically feasible for many (especially small, localized) excavations, they are not applicable to field survey. For these tools to be used in field survey, a cellular connection is required. The tool we hope to design can be used offline and then synchronized with a database once a connection is established.

Fifth, while there are some serviceable open-source projects, these are platform specific (e.g., FAIMS is designed for Android). We prefer a browser based system in order to avoid the problems associated with restricting tools to a particular platform. We would like to build a field data collection system that is open, inexpensive, highly flexible, browser-based, and can be used offline. We believe that this exists in a set of open-source software known as wq.io.

The goal of my project- or rather OUR project for I am working with a fellow institute participant who will have a separate post and other partners are being courted- is to develop a tool that remedies these issues.  We hope that the end product of this project is a tool that:
1.    Is browser-based (and, therefore, device independent)
2.    Can be used off-line (now possible with HTML5)
3.    Employs open source code
4.    Can be connected to a database of choice (proprietary or open-source)
5. is inexpensive and simple (at least on the user end once it has been built)
6. promotes the open use of resulting data

We realize that this is a bit of a pipe dream for we will never be able to do all of this in one year. We plan to have a working prototype. We are feverishly working to figure out the details- more on that in coming posts.